The other day I was having a discussion with my roommate Mike about the physical
intuition of digital photographs, and how performing even the most fundamental
of operations (e.g. resizing) requires an appreciation of the underlying
mathematics. We are both currently in image processing classes, but very
different kinds. His course is in Computer Science, so his studies tend to be of
the use Java; things happen; make apps variety, with only some slight
motivation and understanding of what’s happening under the hood. My course, on
the other hand, is in Electrical Engineering, which means it is of the here’s
some math, and here’s how you do this math in Matlab variety. There’s
advantages to both educational approaches, but debating the merits of theory-
centric versus application-centric education styles is beyond the scope of this
post. Instead I want to quickly motivate some of the fundamental theorems of
Signal Processing and show how they are applied. In this post, I will cover the
first, and most intuitive, of signals: audio.
Time-Frequency Duality
We’re generally used to seeing and hearing things in the so-called “time”
domain, where anything we observe can be called a signal, and because they
often vary over time, they are therefore time-varying signals. Take, for
instance, a clip of the song Safe and Sound.
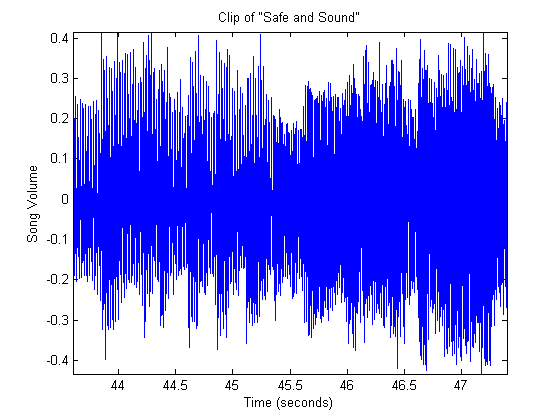
The spikes represent spikes of volume, and read from left to right we see the
content of the music signal for a few seconds. We’re probably all seen this
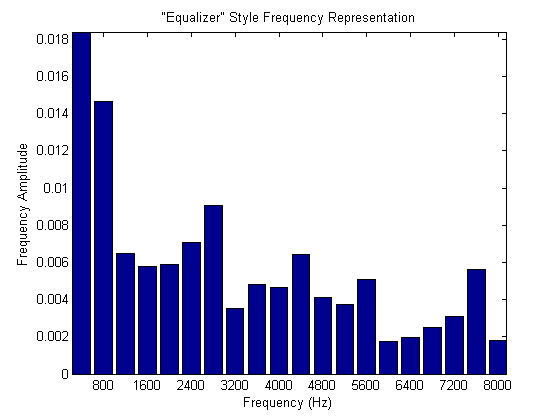
representation before. On the other hand, we could take a look at the
frequency-varying signal representation of the same clip. At the left end,
where the fundamental frequencies of the singing and instruments are present,
the signal is strongest, while the higher end with some details are not as loud.
(Below is an example of the more stylized depiction of frequency representations of music.)
However, these are both representations of the same song! but simply seen from a
different perspective. However, there is an important insight to be had here.
Both the “time” and the “frequency” depictions of a song, or any signal for that
matter, are actually mutually equivalent; there is a duality between time and
frequency.
Filtering is Always in the “Frequency Domain”
When speaking about enhancing music, people often say things like “pump up the
bass” or “boost the mids”. What they really mean, of course, is that they want
to selectively amplify a certain region of the frequencies of a given song,
relative to the other component frequencies. The phenomenon wherein certain
characteristics of a signal are selectively manipulated in some way is called
filtering. For instance, the equalizer in your car filters the songs coming
over airwaves. It can pump up the bass by multiplying the intensity of those
“bass” frequencies by some amount. Similarly, it can mellow the highs by
dividing the intensity of the “high” frequencies by some other amount. In
general, a filter is therefore the construct which, when given a signal,
multiplies, divides, or otherwise shifts frequencies up or down to have some
intended effect.
Edit: This post has a second part available here.